Simulation Modeling with Simio - 6th Edition
Chapter
2
Introduction to SIMIO: The Ice Cream Store
Simulation is a very useful tool. Just about everyone who learns about simulation gets excited about its widespread applicability. A simulation-based investigation can benefit practically any manufacturing, production, or service system. SIMIO can make the application of simulation easier to do and, at the same time, provide a powerful approach for addressing complex problems in designing and improving these types of systems.
Also, simulation is fun when you build visually appealing models, and SIMIO kicks the fun up a notch by offering 3D (i.e., three-dimensional) visualization. Not only does the animation allow you to see how the model is behaving, but people you work with can as well which will greatly increase your credibility with them.
2.1 Getting Started
We assume you have installed SIMIO on your computer and are ready to go.
2.1.1 Invoke SIMIO by either opening the Start menu in Windows or by clicking on a SIMIO icon  that perhaps you have located on the Windows taskbar or on the Desktop. The opening SIMIO window, as seen in Figure 2.1, has the standard Microsoft Office “look and feel.”
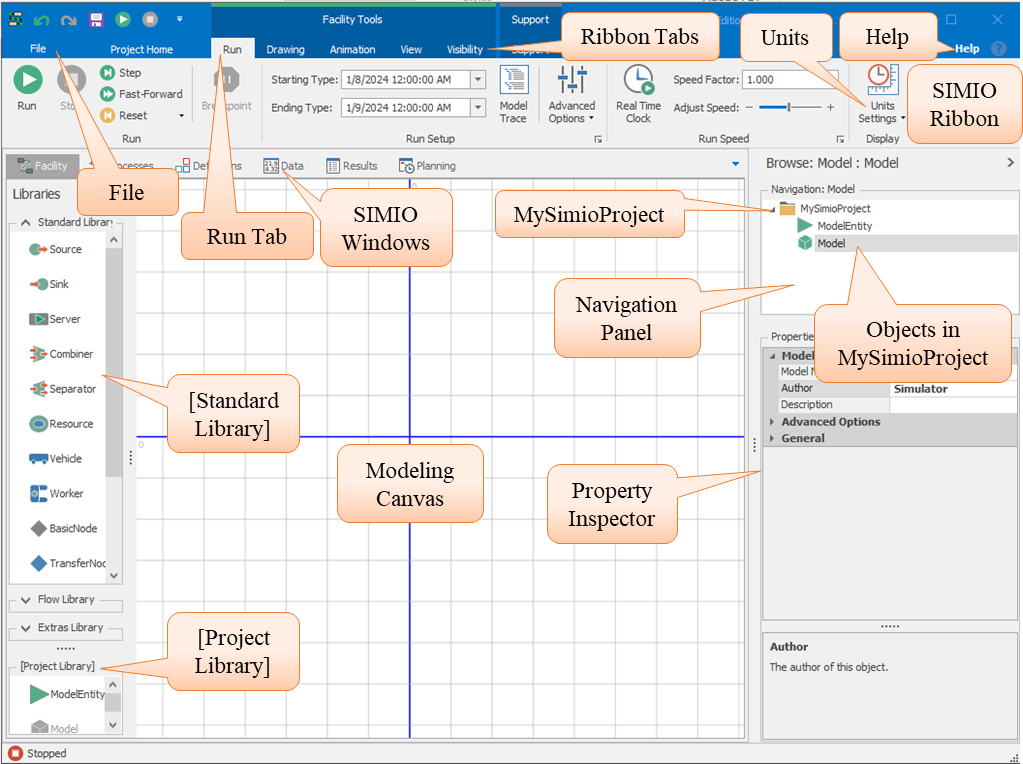
Figure 2.1: Opening SIMIO Window
2.1.2 When you open SIMIO for the first time, you will be placed into a modeling environment. The “Run Tab” of the “SIMIO ribbon” has been selected and contains the Run, Run Setup, Animation Speed, and Display sections.
2.1.3 Below the SIMIO ribbon are the SIMIO window tabs. The “Facility” window has been selected as the canvas for building your simulation models. The SIMIO window displays the “Libraries” area on the left, a “Browse” section on the right, and the middle section, the modeling canvas.
2.1.4 The Libraries section displays the [Standard Library], which contains the modeling object definition icons. Those definitions are used to create objects by clicking on the particular definition icon, dragging the icon to the modeling canvas to position it, and then clicking to complete the object definition. Most of the icons have names that connote their meaning. Also under the Libraries section is the [Flow Library], which will show the object definition icons for modeling various “flow” characteristics (i.e., continuous simulation). The [Extras Library] has additional specific objects to model cranes, robots, and elevators. Finally, the last portion of the Libraries section is the “Project Library,” which will contain the objects that become a part of your SIMIO simulation project, including the ModelEntity object.
2.1.6 Finally, notice the “Help” options in the upper right-hand corner, which can also be invoked through the F1 key. There is a lot of information to be found in the help documents, especially after you have some experience with SIMIO concepts and features.
Other SIMIO resources available to you are found under the SIMO ribbon tab “Support.” In the “Learning Simo” section, the “Sample SimBit Solutions” will refer you to a library of elemental models (each illustrating a particular modeling structure inside of SIMIO), and the “Examples” section will refer you to a library of complete models that provide interesting applications. There are also various books, videos, training, and guides. Also, note the SIMIO “version.”9 in the “My Software” section to keep your version up-to-date.
2.1.7 Two objects are automatically defined when a new model is created (see Figure 2.1). The ModelEntity will create entities that move through our model, while the Model will contain positioned objects and the flow paths of entities. In a sense, the entities will roam around the fixed objects.
2.1.10 The “Units” are a convenient way to set the default specification units for time, length, rate, area, volume, and mass.10
2.2 The Ice Cream Store
A small ice cream store sells ice cream cones. Customers arrive and wait in line to be served by one of two attendants. These attendants take the ice cream order and give the cone(s) back to the customer, who then moves to the separate cashier to pay. After paying, the customers will leave the store. In building a simulation model, it is often important to flowchart the processes. Figure 2.2 shows the four processes of the ice cream store.
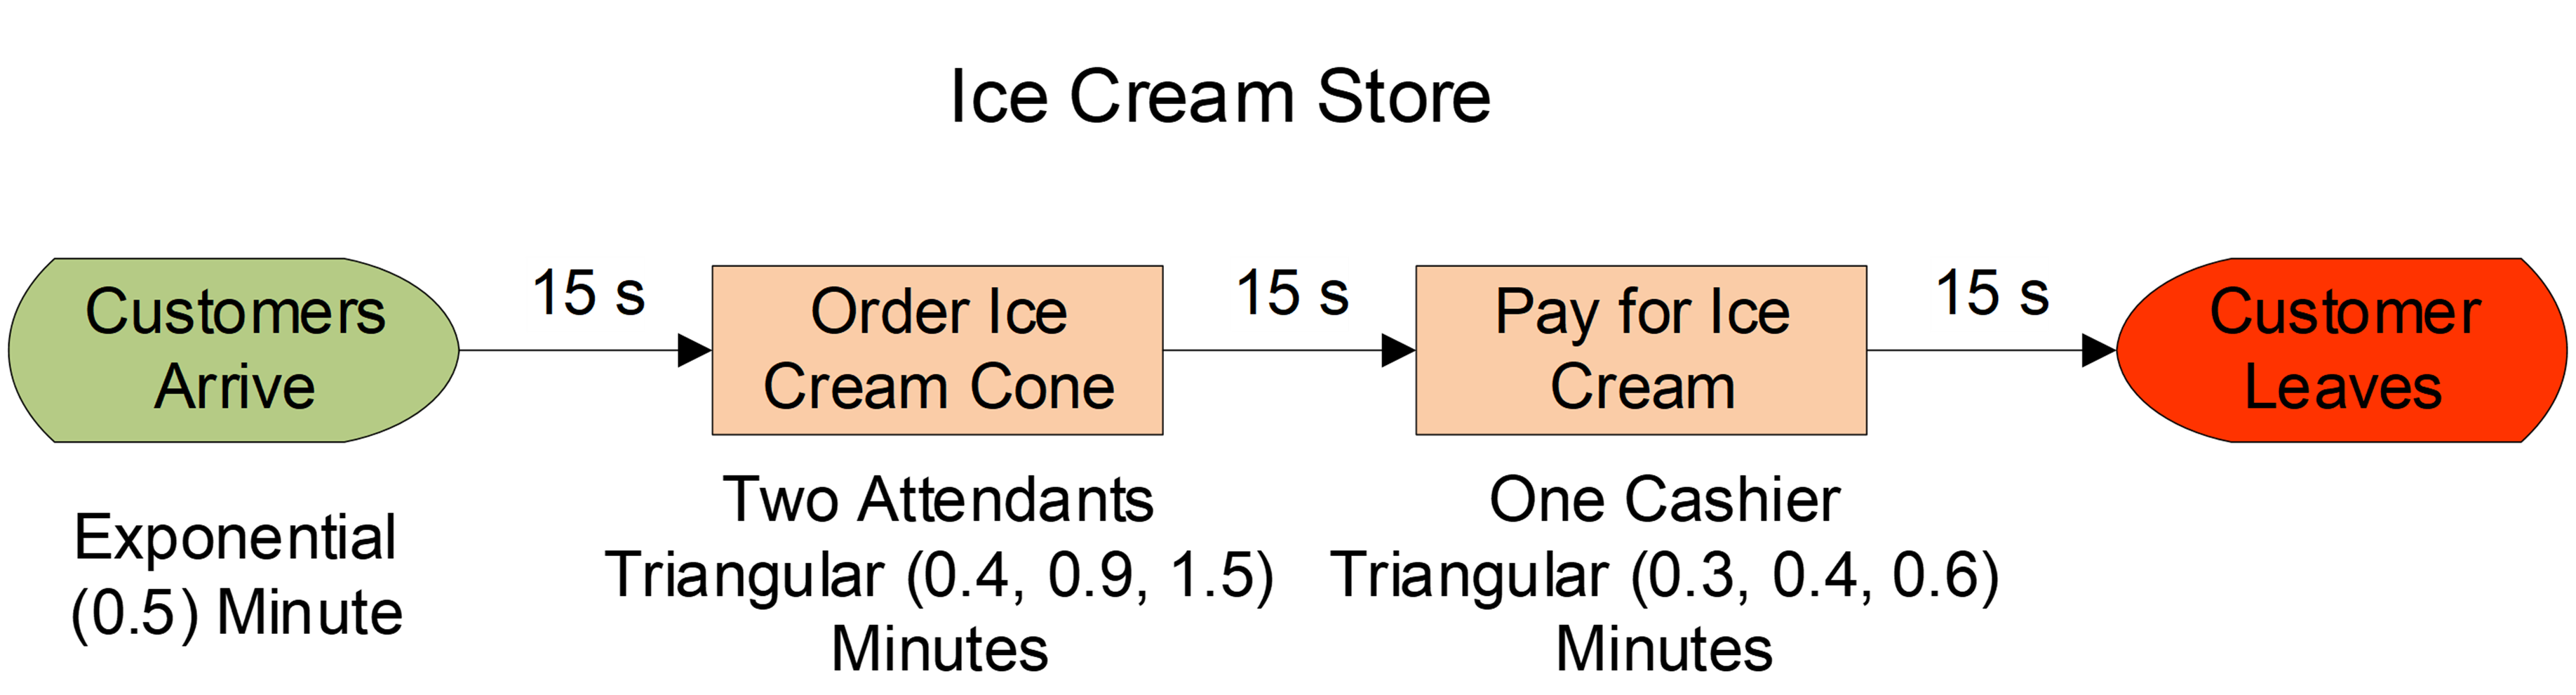
Figure 2.2: Flowchart of Ice Cream Store
In this problem, we will assume we know that:
- Customers arrive Exponentially with a mean interarrival time of 0.5 minutes,
- The time an attendant takes to interact with the customer and give them their ice cream cone(s) is modeled with a Triangular distribution with a minimum of 0.4 minutes, a most likely time of 0.9 minutes, and a maximum of 1.5 minutes,
- The time the cashier takes to accept payment for the ice cream is also Triangular with a minimum of 0.3 minutes, a most likely time of 0.4 minutes, and a maximum of 0.6 minutes and
- The travel time between each process is 15 seconds.
If both attendants are busy, customers will wait in a single line on a first-come, first-served basis. Likewise, there is a single waiting line for the cashier. We will also assume there is no limit to the length of the waiting lines.
2.2.1 It should be fairly clear that a ModelEntity should model the customers while the Model will consist of the flowchart of the Ice Cream Store, as seen in Figure 2.2. Entities are the objects that will traverse through the network of fixed objects. Add an entity to your model by clicking on the ModelEntity object in the [Project Library] panel and dragging it onto the canvas.
2.2.2 Add objects to your model by clicking on the object type in the [Standard Library][] panel. Drag the object around the modeling canvas and click to drop it into position (you can left-click and drag the objects around to relocate or delete them from the model). When you click on an object, its properties appear in the property inspector (typically on the bottom right side panel.)
Add a Source object, two Server objects, and one Sink object – see Figure 2.3.
Connect the process objects with TimePath objects by clicking on the “output” node (blue diamond) of an object and connecting it to the “input” node (grey diamond) of an object. You can click between the nodes to produce a multi-segment path, which allows the path to be more flexible.
Change the default “names” for each object. You can change the object’s name directly or in the “General” property section for each object. Use the names as specified in specified in Figure 2.3.
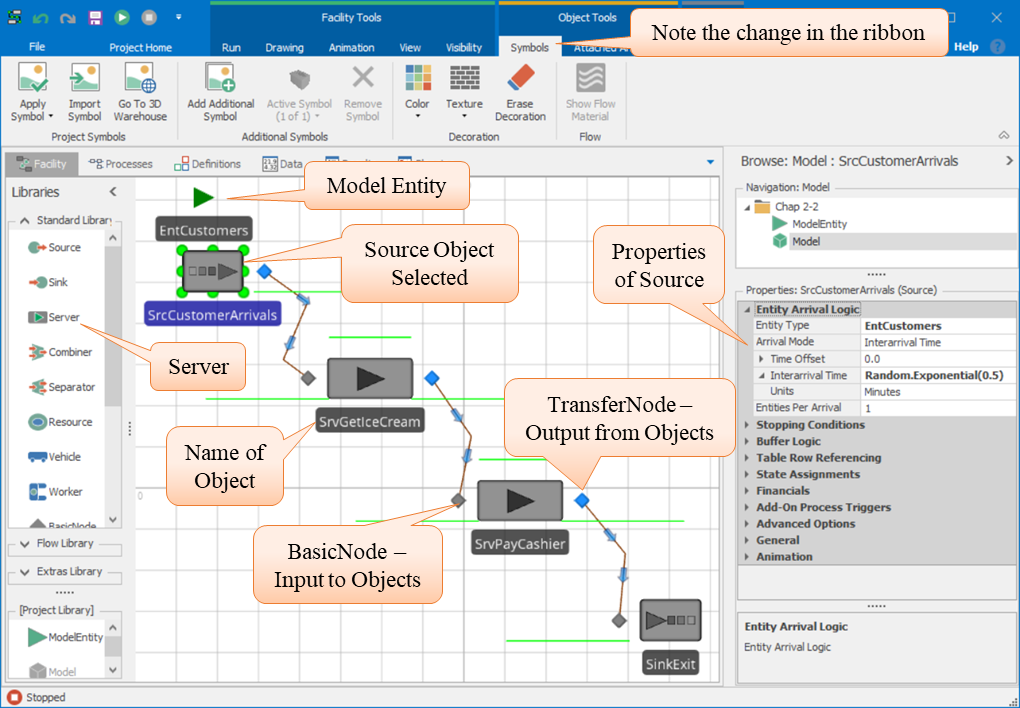
Figure 2.3: Beginning to Model
2.2.2.1 A Server object has three “lines” that surround it. What are they called? (note that a “.” adds further specification)
_______________________________________________
2.2.3 Next, click on each object and fill out its properties according to our assumptions.Figure 2.4 shows the properties associated with the Source object.11
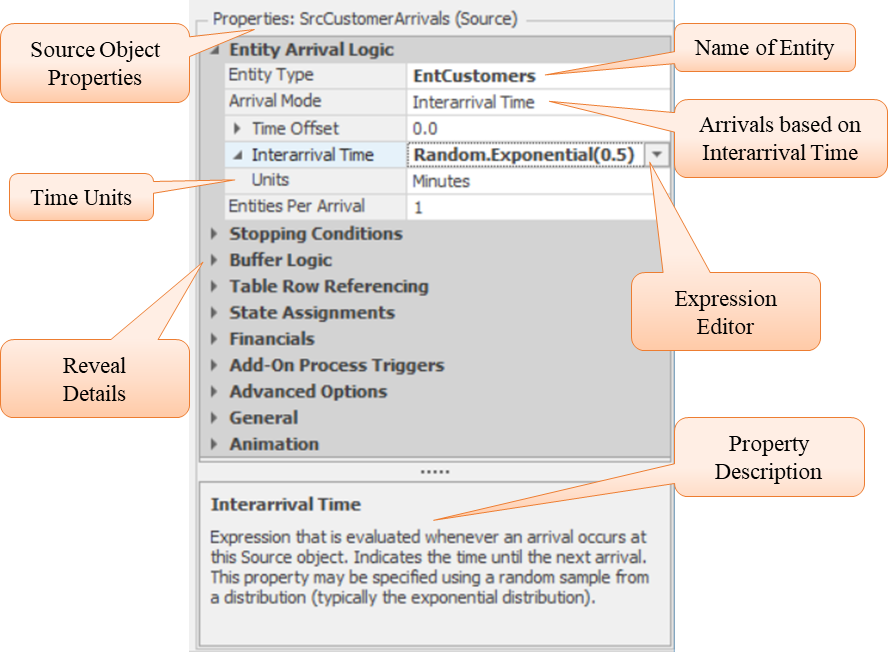
Figure 2.4: Properties of Source
It is important to be sure the time units are correct for expressions
involving time and distance. You may need to reveal the details in a
dialog by clicking the
 icon to show the additional information.
The Expression Editor allows
you to write expressions that have the following form.
icon to show the additional information.
The Expression Editor allows
you to write expressions that have the following form.
Object.SubObject.SubObject(parameters)
The expression editor begins by specifying a character. Then, select the object, its subobject(s), and its properties. The expression editor has “tab-completion,” which means the tab key will complete the name from its first few characters. It also indicates if subobjects are available for this object.
2.2.4 Complete your modeling by adding the information for the two Servers and TimePaths:
- For the SrvGetIceCream server object:
- Initial Capacity: 2
- Processing time: Random.Triangular(0.4, 0.9, 1.5)
- Units: Minutes
- For the SrvPayCashier server object:
- Processing time: Random.Triangular(0.3, 0.4, 0.6)
- Units: Minutes
- For the TimePath objects:
- TravelTime: 15
- Units: Seconds
Note that the object names are listed under the “General” category in the property inspector.
2.2.5 Before we run the model, let’s change the ending time in the Run Setup section of the SIMIO “Run” tab to “Unspecified (Infinite),” as seen in Figure 2.5
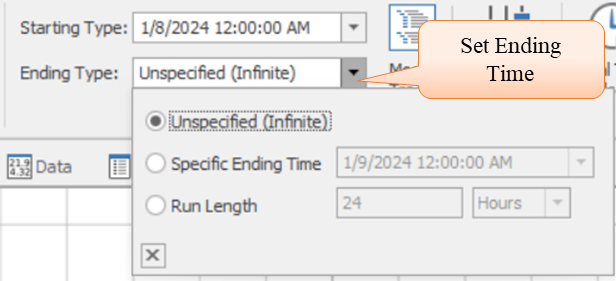
Figure 2.5: Setting the Length of the Run
 to start the simulation and let the simulation “run” for a while.
2.2.7 Notice the ModelEntities ( ) as they move through the model across the TimePaths. The entities queue in the InputBuffer.Contents and then go through service in the Processing.Contents, are both shown as “green lines” that surround the Server objects. You can relocate the objects while the model is running.
2.3 Enhancing the Animation
Animation is often what gets people interested in a model. Although a SIMIO 3-D model might take some work, it can bring a lot of attention. In this section, we will give you instructions on creating an animation that appears in Figure 2.6.
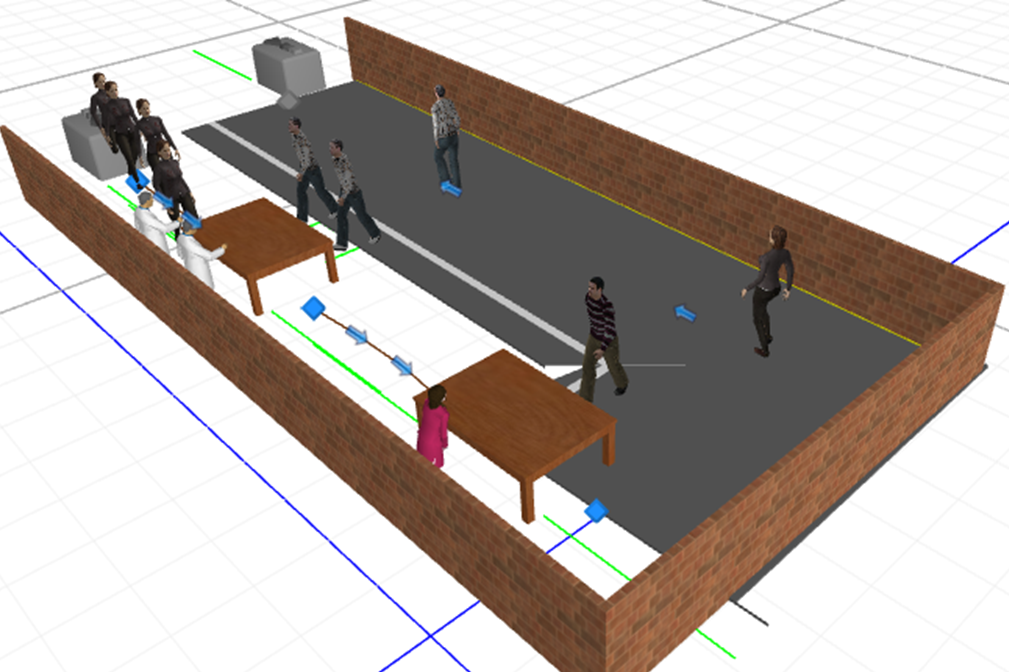
Figure 2.6: The Animation
2.3.1 Make the ice cream store customers look like people rather than triangles. Select the EntCustomer entity (i.e., the green triangle), and under the Symbol→Project Symbols section, look at all the groupings and pick out a person from the “Library\People\Animated”, and click on it to substitute it for the triangle. Look at the picture in 3-D and enlarge it by pulling out one of the bounding ends. Run the simulation. You may want to change the 3-D perspective, as described previously.
2.3.2 Change what happens to the animated people when they are waiting by clicking on the EntCustomer object and expanding the “Animation” details in its Properties Inspector. Change the”Default Animation Action” to “Moving” from “MovingAndIdle” to eliminate the shaking of the animated people when they are idle.
2.3.3 Select the SrvGetIceCream Server object and substitute a “table” for the Server picture by choosing the table under the Symbol→Project Symbols section. Repeat the procedure for the SrvPayCashier Server object. Adjust the size of the server objects to correspond to the persons’ size.
2.3.5 By default, the animated queues (i.e., the three green lines around the server objects) have the entities oriented in the same direction as the entities are traveling. Modify the orientation within the queue as specified in Table 2.1 by selecting the Processing.Contents queue and click the Point or Oriented Point button in the Appearances→Alignment section, as seen in Figure 2.7. You can use Inline for the InputBuffer.Contents queues.
| Queue Alignment Option | Description |
|---|---|
| None | Entities will point from left to right regardless of the queue orientation within the object frame. |
| Inline | Entities will be oriented to point forward along the line. |
| Point | Entities only reside on vertices of the queue but will point in the same direction for all vertices. |
| Oriented Point | Entities only reside on vertices but can be aligned in different directions for each vertex.12 |
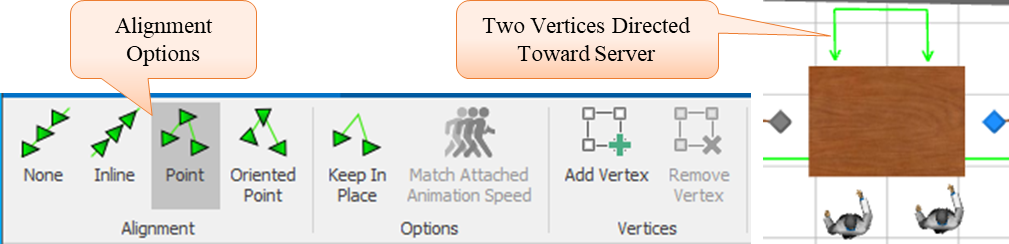
Figure 2.7: Changing the Orientation of the Entities in the Animated Queues
2.3.7 Move the symbols around on the modeling canvas to better represent the ice cream store. You can add walls to your store using the “Polyline” tool from the Drawing tab. Be sure to set the object’s height in the “Object” section of the Drawing tab. The length measurements are in meters unless you specify that the units should be different. You may need to modify the heights of objects to make them consistent.
2.3.8 The path from the SrvPayCashier object to the SnkLeave object can have a “path decorator” added. Path decorators may be added by clicking on the path and selecting a “Decorator.” To see people on this path, change the travel time to 300 seconds.
2.3.10 In the prior animation, the default entity triangle was changed to represent a person, but the exact same person arrived each time. To allow for different people to arrive, select the model entity and click the Add Additional Symbol button under the Symbols→Additional Symbols section to create as many types of people you would like to see arrive. Under the Active Symbol dropdown, select each symbol which will be currently identical to the first and change the symbol following the directions in Step 1 as seen in Figure 2.8 where four total symbols have been added.13 You will need to adjust the sizes of each of the symbols.
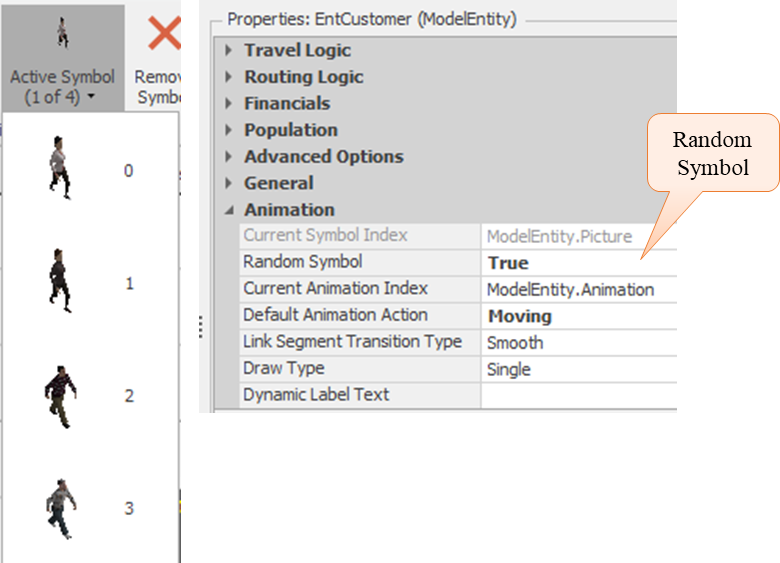
Figure 2.8: Adding Additional Types of People
2.3.11 To use the new symbols, change the Random Symbol property to True under the Animation section of the model entity. Now, each time the Source creates a person, a random symbol will be selected as its picture. Run the new animation and observe what happens, as seen in Figure 2.6.
2.4 Looking at the Results
While the animation brings attention to your model, you will build the simulation model to understand the numerical characteristics of the system being modeled. Typically, you will want to make all the changes to the model until the model accurately represents the system and/or the potential changes have been identified before spending a lot of time on the animation.
2.4.1 First, let’s look at the results from the basic model, as illustrated in Figure 2.9. Perhaps we’ll call this the “present system” model. Under the “Run” tab, change the “Run Length” to 8 hours and run the simulation. The results of this simulation are found under the “Results” tab. Using the “Fast-Forward” choice will not display the animation during the simulation. Whenever the simulation is run using the “Run” tab, it is run in “interactive” mode, allowing one to pause, step, etc., during the simulation, even extending the run length.
2.4.3 The results of a simulation are shown in the form of a “pivot table.” A pivot table arranges the output data according to attributes that head each column, as seen in Figure 2.9.
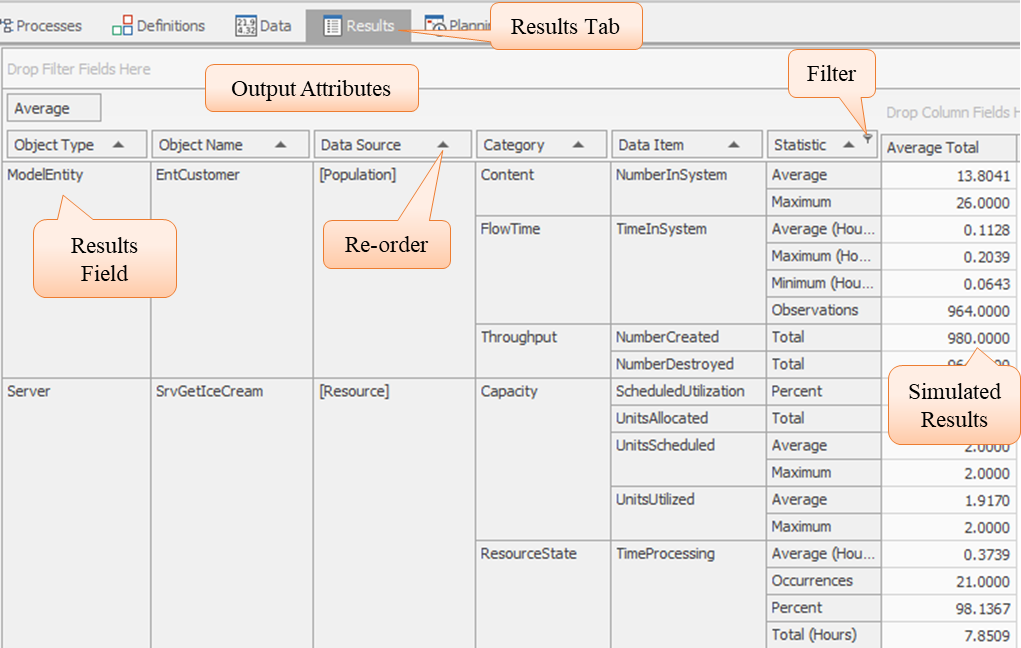
Figure 2.9: Looking at Results
2.4.4 Each Output attribute has two symbols – one to re-order the column and the other to “filter” or select the items displayed in the column.
2.4.7 The “Categories” for statistics are Content, Throughput, Capacity, FlowTime, ResourceState and HoldingTime. These are applied to each data source as they are relevant.
2.4.8 Resource utilization includes “ScheduledUtilization” as well as “UnitsAllocated,” “UnitsScheduled,” and “UnitsUtilized.” These items refer to the actual use of the object’s capacity and the average scheduled capacity. ScheduledUtilization is computed as a ratio of the actual time the resource is utilized divided by the total time its capacity is available. “UnitsUtilized” is the average number of units of the resource that are utilized up to the time this report is generated.
2.4.9 Notice the waiting at the server object is displayed under the “HoldingTime” of the “InputBuffer” while the “Content” of the InputBuffer displays the number in the queue.14
2.4.9.1 What is the average number (content) in the InputBuffer of the SrvGetIceCream server object?
_______________________________________________
2.4.9.2 What is the average waiting time (holding time) in the InputBuffer of the SrvGetIceCream server object?
_______________________________________________
2.5 Commentary
If you have been paying close attention to the model construction, you may have noticed that:
- The SIMIO undo/redo is very convenient. This feature eases the task of trying different modeling features and then “undoing” and “redoing” various changes. Other features of the model, such as path type, can also be easily changed and then changed back by right-clicking on the link.
- You can suppress randomness in your simulation by selecting the “Advanced Options” within the Run Setup section of the “Run” tab and “Disable Randomness.” Doing this will allow you to follow the behavior without randomness to assist in debugging/verifying your model.
If you are familiar with object-oriented design (OOD), the SIMIO [Standard Library] could be appropriately called a “class” library. The simulation objects are created from these class definitions. The act of selecting and dropping an object onto the modeling canvas is what “instantiates” the object. Properties, as displayed in the property inspector, define the characteristics of the objects. Later, you will see how to add your own characteristics. Properties are initialized but cannot be changed. Another type of characteristic, which is called “state variable” in SIMIO, may be added if the characteristic needs to be changed during the simulation. Generally, simulating with only one run (replication) does not generate reliable statistics for results. The next chapter will demonstrate how to obtain multiple replications for a given simulation scenario.
SIMIO “Sprint” releases come out approximately monthly, so the software will be changing rather quickly. Be sure you obtain updates with new features and possibly bug fixes.↩︎
SIMIO internally keeps all times in hours, distances in meters, rates in per hours, weights in kilograms, areas in square meters and volumes in cubic meters.↩︎
Note the default properties that are changed will be bolded to indicate a changed has occurred.↩︎
Note the default queue alignment is None. Also, the Keep in Place option will force the entities to remain at the position they enter in the model. This characteristic is seen in queues that represent systems like waiting rooms (i.e., people do not change seats).↩︎
The color of the clothing can be changed by selecting a color from the Decoration section and clicking on the part of the symbol you would like colored.↩︎
The SIMIO nomenclature of “HoldingTime” and “Content” may seem non-standard. Generally, queuing theory uses the terms “waiting time” and “number in queue”. Also “waiting line length” or “number waiting” is used sometimes instead of “number in queue.”↩︎